Analytics Dashboard
Monitor your loyalty program's performance with real-time metrics, trends, and insights.
Accessing Analytics
Click Analytics in the left sidebar (under the Analytics group):
Key Metrics
📊 Active Members
What it means: Total customers enrolled in your program Why it matters: Shows program reach
Example: 12,450 active members
  ├─ 3,245 in last 30 days (active)
  ├─ 6,120 in last 90 days (semi-active)
  └─ 3,085 no activity (dormant, 90+ days)
Benchmark: 30-50% of your customer base should be enrolled.
💰 Points in Circulation
What it means: Total unredeemed points across all members Why it matters: Shows your liability and member engagement
Example: 2,567,890 total points issued
  ├─ 1,890,450 unredeemed (members hold)
  ├─ 677,440 redeemed (spent on rewards)
  └─ If avg reward costs 1000 pts, you owe ~$1,890 in value
Healthy range: 3-6 months of expected redemptions
👥 Average Points Per Member
What it means: (Total Points Issued) ÷ (Number of Members) Why it matters: Shows earning velocity
Example: 2,567,890 points ÷ 12,450 members = 206 pts/member
  High (300+): Customers earning fast, rewards may need adjustment
  Medium (150-250): Balanced earning
  Low (<100): Low engagement, consider earn rule boost
🎁 Redemption Rate
What it means: What % of issued points get redeemed Why it matters: Shows reward appeal
Example: 677,440 redeemed ÷ 2,567,890 issued = 26% redemption rate

  High (40%+): Customers love your rewards, healthy program
  Medium (25-40%): Good balance
  Low (<20%): Members earning but not redeeming (rewards unappealing?)
📈 Engagement Rate
What it means: % of members with activity in selected period Why it matters: Shows program stickiness
Example: 42% engagement
  ├─ 5,250 members earned points this month
  ├─ 4,120 members viewed their balance
  └─ 2,890 members redeemed rewards
Benchmark: Aim for 30%+ for healthy programs.
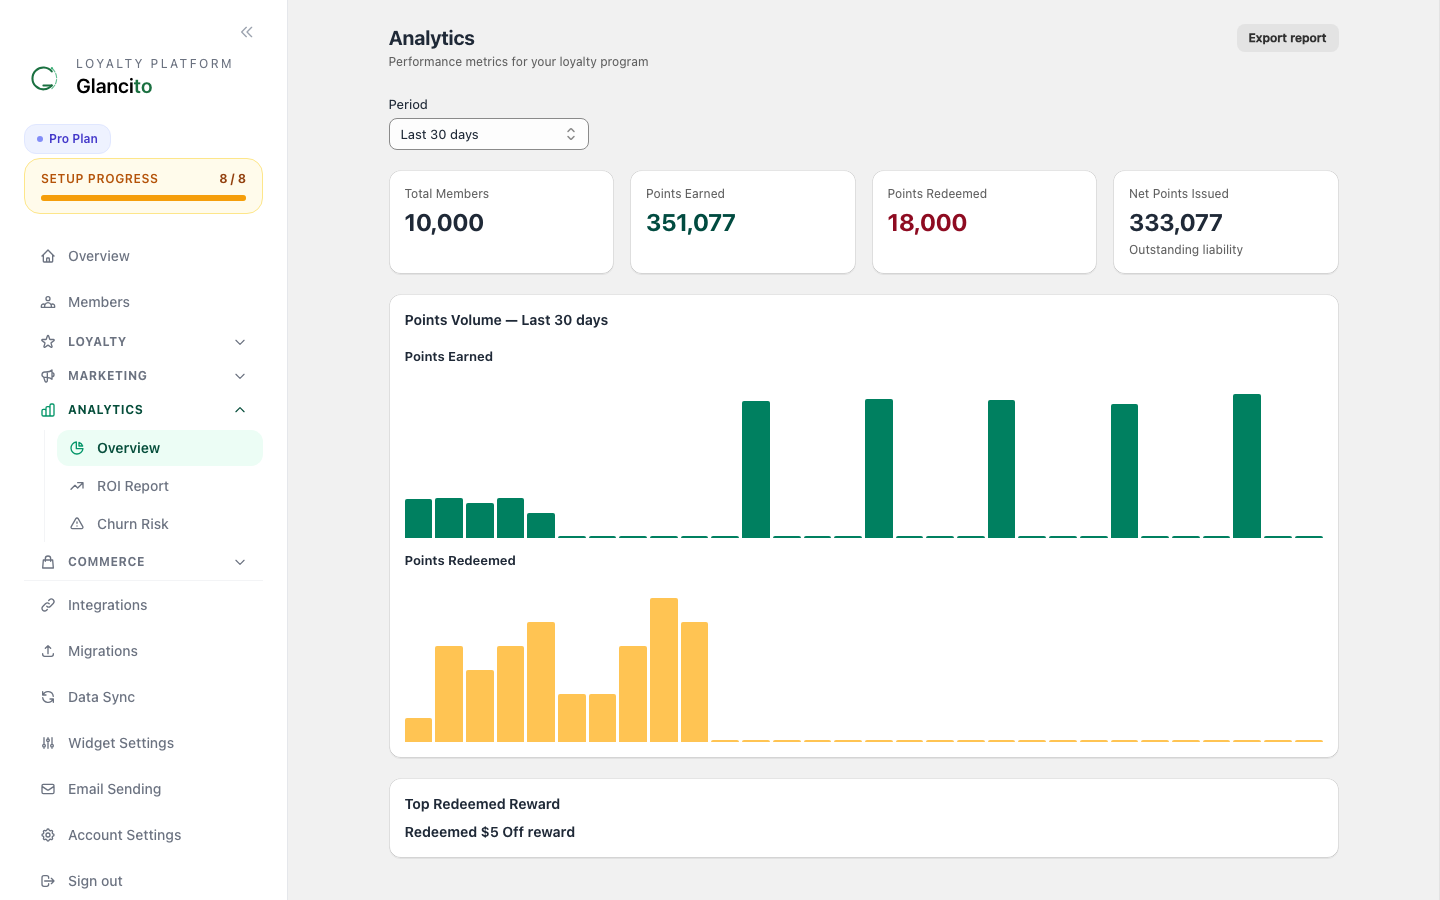
Charts & Trends
The Analytics page shows real-time charts for points earned vs. redeemed, member growth, top earning rules, and redemptions by reward — all filterable by date range.
What to look for:
- Spikes on weekends = Normal (shopping days)
- Consistent daily line = Steady engagement
- Gaps in redemptions = Check reward appeal
Healthy growth: 2-5% monthly increase.
Use this to:
- Identify which rules drive engagement
- Disable underperforming rules
- Spot rewards that aren't being claimed and adjust their cost
Campaign Performance
Open Segments → click a sent campaign to see per-campaign analytics. Every event (sent, bounced, opened, clicked, unsubscribed, complained) is stored per recipient and aggregated in real time.
Good benchmarks:
- Delivery rate: > 98%
- Open rate: 25–35%
- Click rate: 3–7%
- Unsubscribe: < 0.5%
- Complaint: < 0.1%
See Campaign Analytics for full metric definitions, UTM tracking, and open/click tracking details.
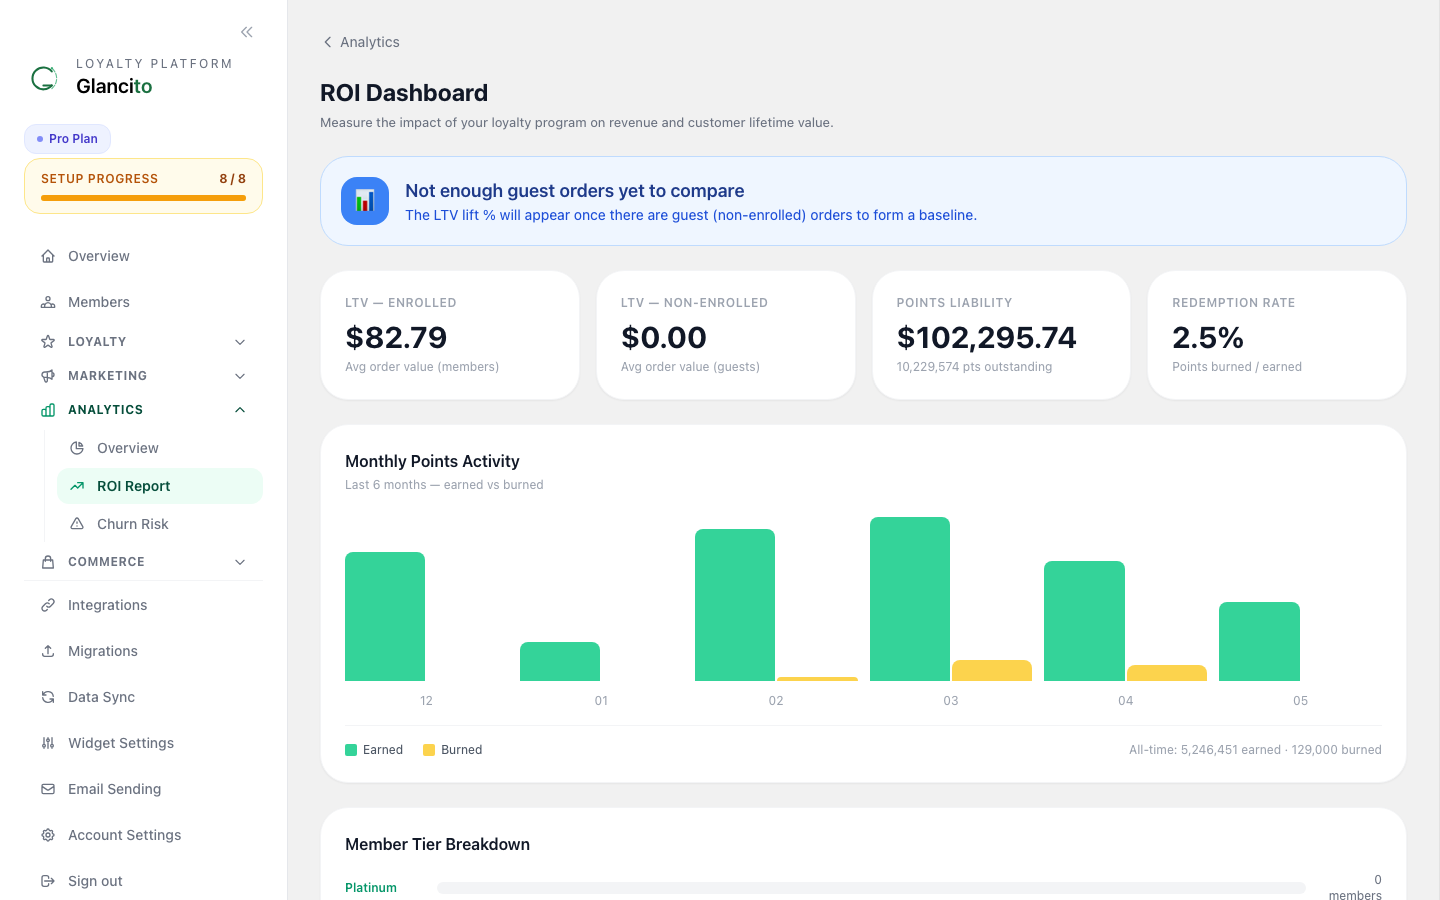
Member Analytics
The ROI sub-page shows customer lifetime value distribution and predicted revenue:
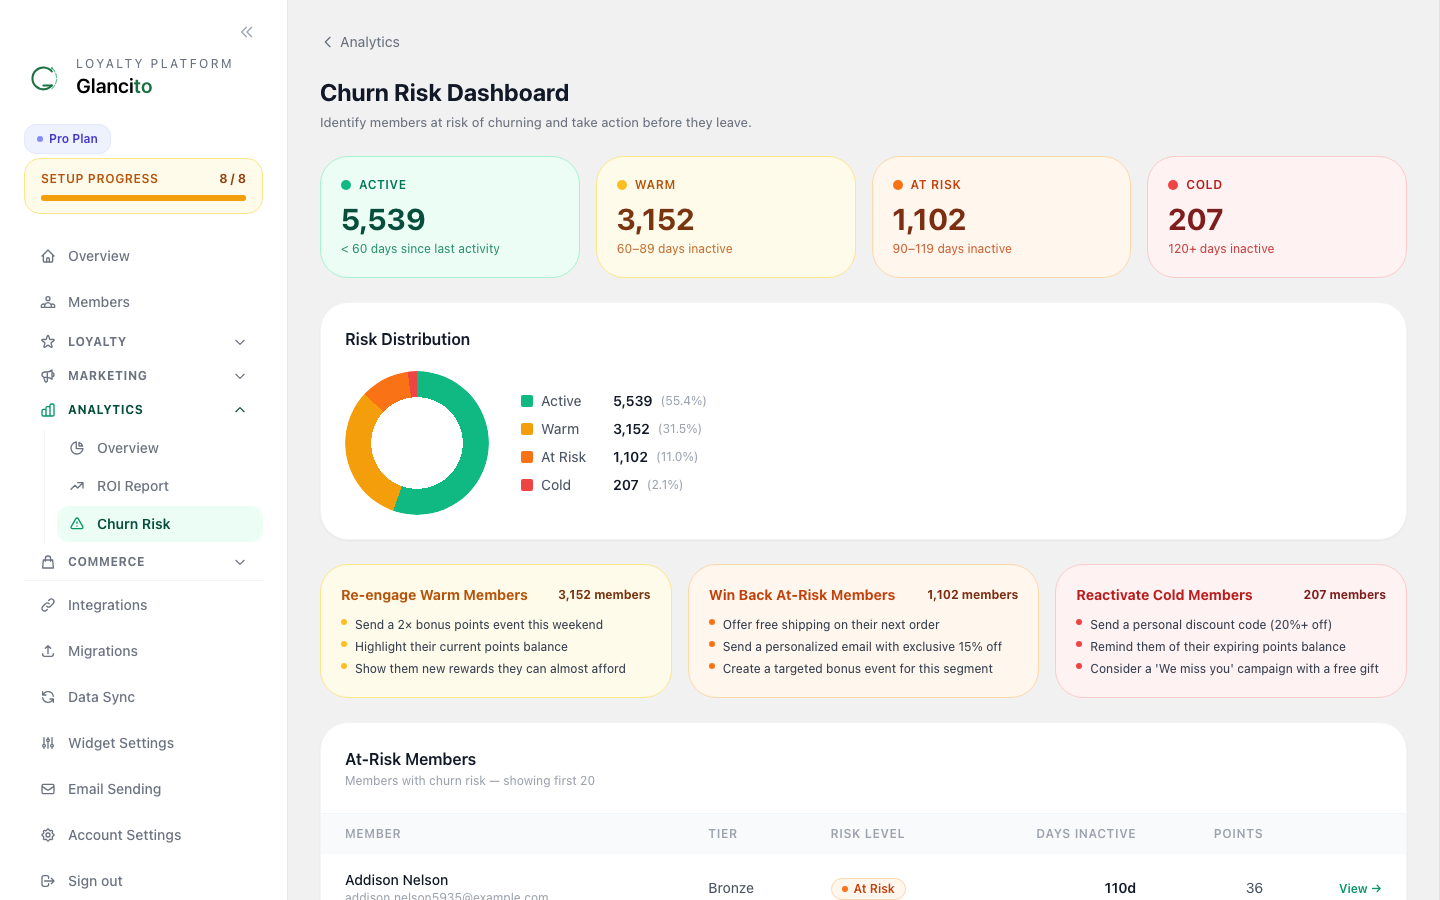
The Churn sub-page shows churn risk distribution across your member base — Low, Medium, and High risk — and flags members who haven't purchased recently:
Use churn analytics to build a win-back segment and target at-risk members with a re-engagement campaign.
Points Economics
Key ratios to monitor:
| Metric | Healthy Range |
|---|---|
| Points per $1 spent | 0.8 – 1.5 |
| Cost per point | < $0.02 |
| Redemption margin | > 50% |
| Loyalty order uplift | +$10 – $30 vs no-loyalty orders |
A slightly higher-than-configured points-per-dollar rate is normal when bonus rules (referrals, birthdays) are active.
Filtering & Date Ranges
Use the date range selector at the top of the Analytics page. Presets: Last 7 Days, Last 30 Days (default), Last 90 Days, Last 12 Months, or a custom date range. Charts update immediately on selection.
Exporting Data
Click Export CSV on any chart or metric table to download the underlying data for analysis in Excel or Sheets.
Best Practices
Weekly Review
Every Monday morning, check:
- Points issued last week (vs. prior week)
- Member growth
- Redemption rate
Goal: Ensure program is healthy.
Monthly Deep Dive
First of month, review:
- Top earning rules
- Top redemption rewards
- Campaign performance
- Churn risk members
- CLV trends
Goal: Identify what's working, what needs adjustment.
Quarterly Strategy Session
Every 3 months:
- Review full-year trends
- Compare to benchmarks
- Adjust earn/reward mix
- Plan campaigns
- Set growth targets
Common Questions
Q: Why did points issued drop this week? A: Check if:
- You disabled an earn rule
- Sales were lower (fewer orders)
- It's a holiday/slow season
Q: Should I worry about low redemption rate? A: Not always. Low (20%) can be healthy if:
- Customers are saving for premium rewards (aspirational)
- You want to keep points circulating
High (50%+) suggests rewards are too cheap.
Q: What's a good CLV? A: Depends on your margins. As a rule:
- CLV should be 3-5x first purchase value
- Example: First order $50 → CLV target $150-250
Q: How do I improve repeat purchase rate? A: Send campaigns to:
- "Points Near Reward" segment (nudge them to redeem)
- New members (encourage habit formation)
- Lapsed buyers (win them back)
Next Steps
- Send campaigns to drive engagement
- Create segments for targeted analytics
- Adjust earn rules based on performance
- Review member profiles for personalized insights
- Campaign Analytics — deep-dive on open/click tracking and UTM params
- Email Deliverability — consent, bounce handling, and unsubscribe